Featured Quizzes
User Quizzes
Create Quiz
Data and Charts
Word Search
Flash Cards
Badges and Games
About JetPunk
Message Board
Random Quiz
Dark Mode
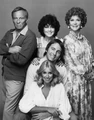
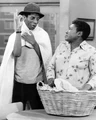
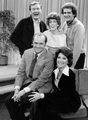
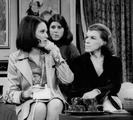
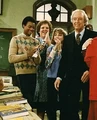
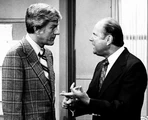
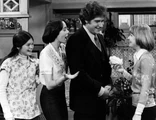
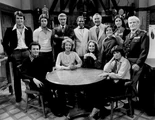
1970s TV Sitcoms by Picture - Statistics
General Stats
- This quiz has been taken 238 times
- The average score is 21 of 32
Answer Stats
| Picture | Hint | Answer | % Correct |
|---|---|---|---|
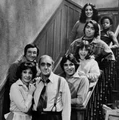
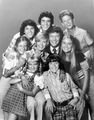 | 1969-1974 | The Brady Bunch | 94%
|
 | 1974-1984 | Happy Days | 89%
|
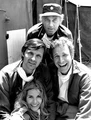 | 1972-1983 | Mash | 89%
|
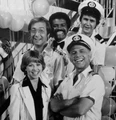 | 1977-1987 | Love Boat | 85%
|
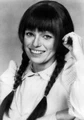
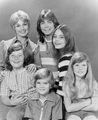 | 1970-1974 | Partridge Family | 85%
|
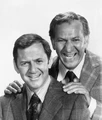 | 1970-1975 | The Odd Couple | 85%
|
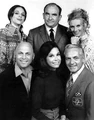 | 1970-1977 | The Mary Tyler Moore Show | 84%
|
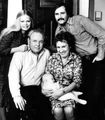 | 1971-1979 | All In The Family | 82%
|
 | 1976-1983 | Laverne and Shirley | 81%
|
 | 1972-1977 | Sanford and Son | 80%
|
 | 1972-1978 | Maude | 79%
|
 | 1975-1979 | Welcome Back, Kotter | 79%
|
 | 1977-1984 | Three's Company | 77%
|
 | 1974-1979 | Good Times | 76%
|
 | 1972-1978 | Bob Newhart | 74%
|
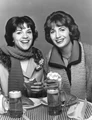
 | 1974-1978 | Rhoda | 71%
|
 | 1978-1982 | Mork And Mindy | 69%
|
 | 1976-1985 | Alice | 68%
|
 | 1975-1982 | Barney Miller | 68%
|
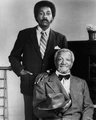
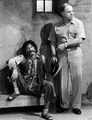
 | 1974-1978 | Chico and the Man | 64%
|
 | 1978-1985 | Diff'rent Strokes | 64%
|
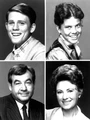
 | 1971-1974 | The New Dick Van Dyke Show | 53%
|
 | 1975-1984 | One Day At A Time | 51%
|
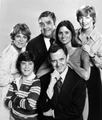
 | 1977-1981 | Soap | 50%
|
 | 1977-1978 | Fish | 46%
|
 | 1976-1977 | Mary Hartman, Mary Hartman | 46%
|
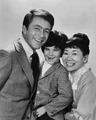 | 1969-1972 | Courtship of Eddie's Father | 41%
|
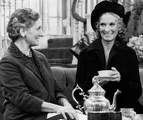 | 1975-1977 | Phyllis | 34%
|
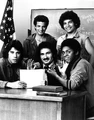
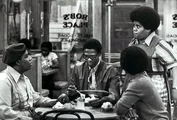 | 1976-1979 | What's Happening | 34%
|
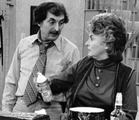
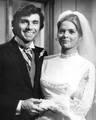 | 1972-1973 | Bridget Loves Bernie | 24%
|
 | 1976-1978 | The Tony Randall Show | 17%
|
 | 1976-1978 | C.P.O. Sharkey | 13%
|
No matching quizzes found
Score Distribution
Percent of People with Each Score
Percentile by Number Answered
Your Score History
You have not taken this quiz
New and Popular