
Quiz étoilés
Quiz des utilisateurs
Créer un quiz
Flash Cards
À propos de JetPunk
Quiz aléatoire
Mode sombre
Logo des départements de France - Statistiques
Statistiques générales
- Ce quiz a été pris 16 fois
- Le résultat moyen est 43 sur 99
Statistiques - réponses
| Par images | Hint | Réponse | % Correct |
|---|---|---|---|
 | 679 344 habitants | Ain | 100%
|
 | 523 342 habitants | Aisne | 93%
|
 | 333 298 habitants | Allier | 64%
|
 | 861 158 habitants | Haute-Savoie | 57%
|
 | 231 349 habitants | Hautes-Pyrénées | 57%
|
 | 373 167 habitants | Haute-Vienne | 57%
|
 | 619 362 habitants | Indre-et-Loire | 57%
|
 | 1 298 990 habitants | Isère | 57%
|
 | 1 914 667 habitants | Rhône | 57%
|
 | 550 310 habitants | Saône-et-Loire | 57%
|
 | 448 226 habitants | Savoie | 57%
|
 | 1 338 485 habitants | Essonne | 50%
|
 | 384 160 habitants | Guadeloupe | 50%
|
 | 233 185 habitants | Haute-Saône | 50%
|
 | 1 654 712 habitants | Hauts-de-Seine | 50%
|
 | 257 973 habitants | Jura | 50%
|
 | 774 133 habitants | Loire | 50%
|
 | 1 487 570 habitants | Loire-Atlantique | 50%
|
 | 691 268 habitants | Loiret | 50%
|
 | 833 776 habitants | Maine-et-Loire | 50%
|
 | 783 390 habitants | Morbihan | 50%
|
 | 2 103 778 habitants | Paris | 50%
|
 | 1 468 108 habitants | Seine-et-Marne | 50%
|
 | 1 704 316 habitants | Seine-Saint-Denis | 50%
|
 | 265 817 habitants | Tarn-et-Garonne | 50%
|
 | 1 426 929 habitants | Val-de-Marne | 50%
|
 | 1 281 653 habitants | Val-d'Oise | 50%
|
 | 713 609 habitants | Vendée | 50%
|
 | 438 897 habitants | Vienne | 50%
|
 | 1 485 086 habitants | Yvelines | 50%
|
 | 1 128 418 habitants | Alpes-Maritimes | 43%
|
 | 1 934 548 habitants | Communauté européenne d'Alsace | 43%
|
 | 115 527 habitants | Creuse | 43%
|
 | 524 207 habitants | Drôme | 43%
|
 | 770 940 habitants | Gard | 43%
|
 | 192 645 habitants | Gers | 43%
|
 | 1 690 493 habitants | Gironde | 43%
|
 | 293 996 habitants | Guyane | 43%
|
 | 1 471 468 habitants | Haute-Garonne | 43%
|
 | 168 331 habitants | Haute-Marne | 43%
|
 | 1 230 289 habitants | Hérault | 43%
|
 | 216 069 habitants | Indre | 43%
|
 | 889 679 habitants | La Réunion | 43%
|
 | 328 543 habitants | Loir-et-Cher | 43%
|
 | 176 473 habitants | Lot | 43%
|
 | 333 602 habitants | Lot-et-Garonne | 43%
|
 | 563 076 habitants | Marne | 43%
|
 | 360 630 habitants | Martinique | 43%
|
 | 305 468 habitants | Mayenne | 43%
|
 | 256 518 habitants | Mayotte | 43%
|
 | 732 236 habitants | Meurthe-et-Moselle | 43%
|
 | 180 290 habitants | Meuse | 43%
|
 | 1 051 309 habitants | Moselle | 43%
|
 | 201 417 habitants | Nièvre | 43%
|
 | 2 615 635 habitants | Nord | 43%
|
 | 664 453 habitants | Puy-de-Dôme | 43%
|
 | 706 564 habitants | Pyrénées-Atlantiques | 43%
|
 | 496 855 habitants | Pyrénées-Orientales | 43%
|
 | 566 733 habitants | Sarthe | 43%
|
 | 1 260 964 habitants | Seine-Maritime | 43%
|
 | 397 352 habitants | Tarn | 43%
|
 | 1 119 307 habitants | Var | 43%
|
 | 357 248 habitants | Vosges | 43%
|
 | 332 267 habitants | Yonne | 43%
|
 | 168 054 habitants | Alpes-de-Haute-Provence | 36%
|
 | 334 231 habitants | Ardèche | 36%
|
 | 265 893 habitants | Ardennes | 36%
|
 | 155 722 habitants | Ariège | 36%
|
 | 310 447 habitants | Aube | 36%
|
 | 379 648 habitants | Aude | 36%
|
 | 279 609 habitants | Aveyron | 36%
|
 | 2 087 658 habitants | Bouches-du-Rhône | 36%
|
 | 709 441 habitants | Calvados | 36%
|
 | 144 196 habitants | Cantal | 36%
|
 | 352 683 habitants | Charente | 36%
|
 | 672 279 habitants | Charente-Maritime | 36%
|
 | 540 100 habitants | Côte-d'Or | 36%
|
 | 375 229 habitants | Deux-Sèvres | 36%
|
 | 417 614 habitants | Dordogne | 36%
|
 | 547 163 habitants | Doubs | 36%
|
 | 602 714 habitants | Eure | 36%
|
 | 433 129 habitants | Eure-et-Loir | 36%
|
 | 933 455 habitants | Finistère | 36%
|
 | 228 654 habitants | Haute-Loire | 36%
|
 | 143 467 habitants | Hautes-Alpes | 36%
|
 | 1 120 666 habitants | Ille-et-Vilaine | 36%
|
 | 433 570 habitants | Landes | 36%
|
 | 76 486 habitants | Lozère | 36%
|
 | 497 522 habitants | Manche | 36%
|
 | 829 899 habitants | Oise | 36%
|
 | 275 201 habitants | Orne | 36%
|
 | 1 457 905 habitants | Pas-de-Calais | 36%
|
 | 140 255 habitants | Territoire de Belfort | 36%
|
 | 572 056 habitants | Vaucluse | 36%
|
 | 298 660 habitants | Cher | 29%
|
 | 168 306 habitants | Collectivité de Corse | 29%
|
 | 240 826 habitants | Corrèze | 29%
|
 | 611 859 habitants | Côtes-d'Armor | 29%
|
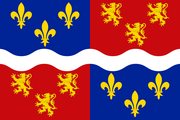 | 565 413 habitants | Somme | 21%
|
Aucun quiz correspondant
Distribution des résultats
% des personnes avec chaque résultat
Percentile par nombre de réponses
Votre historique - résultats
Vous n’avez pas pris ce quiz
Nouveau et populaire
Copyright H Brothers Inc., 2008–2026