
What if Canada and Greenland join the United States?
First published: Thursday May 8th, 2025
Report this blog
The new electoral landscape
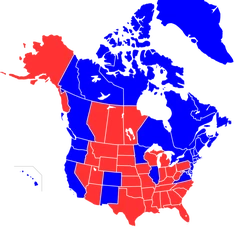
So what if Trump gets what he wants that Canada and Greenland become part of the United States? Rather than Canada being the 51st state, it makes more sense for each province to become a state, i.e. 51st to 60th states, while the sparsely populated territories and Greenland become "districts" similar to Washington DC. With this assumption, how would it change the electoral map of the expanded United States?
Now assuming the number of seats in the US House of Representatives remains capped at 435, it means that some existing US congress members will have to give ways to the Canadian. Based on the US congressional apportionment rule and the 2020 census data from the US (and 2021 from Canada), the following table lists the new "states" and their respective number of representatives.
| State / District | Population | Num of Reps | Changes | Electoral College |
|---|---|---|---|---|
| California | 39,538,223 | 46 | -6 | 48 |
| Texas | 29,145,505 | 34 | -4 | 36 |
| Florida | 21,538,187 | 25 | -3 | 27 |
| New York | 20,201,249 | 24 | -2 | 26 |
| Ontario | 14,223,942 | 17 | +17 | 19 |
| Pennsylvania | 13,002,700 | 15 | -2 | 17 |
| Illinois | 12,812,508 | 15 | -2 | 17 |
| Ohio | 11,799,448 | 14 | -1 | 16 |
| Georgia | 10,711,908 | 13 | -1 | 15 |
| North Carolina | 10,439,388 | 12 | -2 | 14 |
| Michigan | 10,077,331 | 12 | -1 | 14 |
| New Jersey | 9,288,994 | 11 | -1 | 13 |
| Virginia | 8,631,393 | 10 | -1 | 12 |
| Quebec | 8,501,833 | 10 | +10 | 12 |
| Washington | 7,705,281 | 9 | -1 | 11 |
| Arizona | 7,151,502 | 8 | -1 | 10 |
| Massachusetts | 7,029,917 | 8 | -1 | 10 |
| Tennessee | 6,910,840 | 8 | -1 | 10 |
| Indiana | 6,785,528 | 8 | -1 | 10 |
| Maryland | 6,177,224 | 7 | -1 | 9 |
| Missouri | 6,154,913 | 7 | -1 | 9 |
| Wisconsin | 5,893,718 | 7 | -1 | 9 |
| Colorado | 5,773,714 | 7 | -1 | 9 |
| Minnesota | 5,706,494 | 7 | -1 | 9 |
| South Carolina | 5,118,425 | 6 | -1 | 8 |
| Alabama | 5,024,279 | 6 | -1 | 8 |
| British Columbia | 5,000,879 | 6 | +6 | 8 |
| Louisiana | 4,657,757 | 6 | 0 | 8 |
| Kentucky | 4,505,836 | 5 | -1 | 7 |
| Alberta | 4,262,635 | 5 | +5 | 7 |
| Oregon | 4,237,256 | 5 | -1 | 7 |
| Oklahoma | 3,959,353 | 5 | 0 | 7 |
| Connecticut | 3,605,944 | 4 | -1 | 6 |
| Utah | 3,271,616 | 4 | 0 | 6 |
| Iowa | 3,190,369 | 4 | 0 | 6 |
| Nevada | 3,104,614 | 4 | 0 | 6 |
| Arkansas | 3,011,524 | 4 | 0 | 6 |
| Mississippi | 2,961,279 | 4 | 0 | 6 |
| Kansas | 2,937,880 | 3 | -1 | 5 |
| New Mexico | 2,117,522 | 3 | 0 | 5 |
| Nebraska | 1,961,504 | 2 | -1 | 4 |
| Idaho | 1,839,106 | 2 | 0 | 4 |
| West Virginia | 1,793,716 | 2 | 0 | 4 |
| Hawaii | 1,455,271 | 2 | 0 | 4 |
| New Hampshire | 1,377,529 | 2 | 0 | 4 |
| Maine | 1,362,359 | 2 | 0 | 4 |
| Manitoba | 1,342,153 | 2 | +2 | 4 |
| Saskatchewan | 1,132,505 | 1 | +1 | 3 |
| Rhode Island | 1,097,379 | 1 | -1 | 3 |
| Montana | 1,084,225 | 1 | -1 | 3 |
| Delaware | 989,948 | 1 | 0 | 3 |
| Nova Scotia | 969,383 | 1 | +1 | 3 |
| South Dakota | 886,667 | 1 | 0 | 3 |
| North Dakota | 779,094 | 1 | 0 | 3 |
| New Brunswick | 775,610 | 1 | +1 | 3 |
| Alaska | 733,391 | 1 | 0 | 3 |
| District of Columbia | 689,545 | 0 | 0 | 3 |
| Vermont | 643,077 | 1 | 0 | 3 |
| Wyoming | 576,851 | 1 | 0 | 3 |
| Newfoundland and Labrador | 510,550 | 1 | +1 | 3 |
| Prince Edward Island | 154,331 | 1 | +1 | 3 |
| Greenland | 56,699* | 0 | 0 | 3 |
| Northwest Territories | 41,070 | 0 | 0 | 3 |
| Yukon | 40,232 | 0 | 0 | 3 |
| Nunavut | 36,858 | 0 | 0 | 3 |
Would this change the presidential election result?
With the addition of 10 states and 4 districts, the electoral college will increase from 538 to 570. It will require at least 286 electoral votes to win the presidency.
Based on the 2025 Canadian federal election results, assuming those favour the Liberals will vote for the Democrats and the Conversative for the Republicans, this is how the new states will split between red and blue.
| Province / Territory | Liberal | Conservative | Dem / Rep |
|---|---|---|---|
| Ontario | 49.6% | 44.3% | Democratic |
| Quebec | 43.0% | 23.5% | Democratic |
| British Columbia | 42.3% | 41.5% | Democratic |
| Alberta | 28.4% | 64.8% | Republican |
| Manitoba | 41.2% | 46.9% | Republican |
| Saskatchewan | 26.8% | 65.1% | Republican |
| Nova Scotia | 58.1% | 35.7% | Democratic |
| New Brunswick | 54.1% | 41.3% | Democratic |
| Newfoundland and Labrador | 54.4% | 40.0% | Democratic |
| Prince Edward Island | 58.0% | 37.2% | Democratic |
| Territories | 50.5% | 34.6% | Democratic |
And the Greenland 2025 election was won by the Democrats which opposes joining the US, so it can be assumed that Greenland will be a blue "district".
| Party | Vote % |
|---|---|
| Democrats | 30.26 |
| Naleraq | 24.77 |
| Inuit Ataqatigiit | 21.62 |
| Siumut | 14.88 |
| Atassut | 7.39 |
Together with the 2024 US election result, this is what the new electoral map will look like:
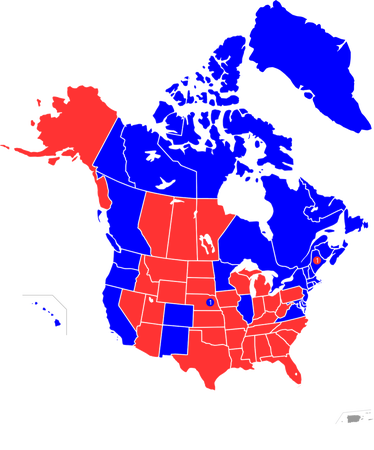
This equates to 269 electoral votes for the Democrats, still short of the 286 required to win. This is assuming that the Democrats will still win 1 electoral college vote from Nebraska despite its total now reduces from 5 to 4.
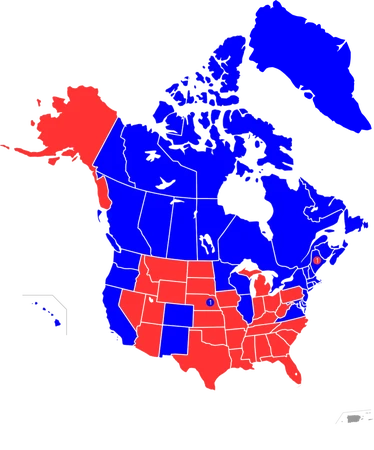
But what if the Canadians hate Donald Trump so much that the Prairie "states" all turn to blue? It will increase the Democrats' votes to 283, still 3 short of the majority.
So for the Democrats to win the next election, even with the help of the Canadians and Greenlanders, they will have to flip at least one red state into blue. The most marginal one is Wisconsin (49.60% vs 48.74%, or a difference of 29,397 votes in the 2024 election). It will add 9 more electoral votes, bringing the total to 292 votes.
I hope this is an accurate analysis of what will (and hopefully never) happen and an interesting read. Let me know if any assumption or calculation is incorrect. Thanks for reading.