My Maps - Episode 5
Blog by
First published: Tuesday January 20th, 2026
Report this blog
First published: Tuesday January 20th, 2026
Report this blog
+8
MapTime
Yallalloollaa, this time more US Maps!
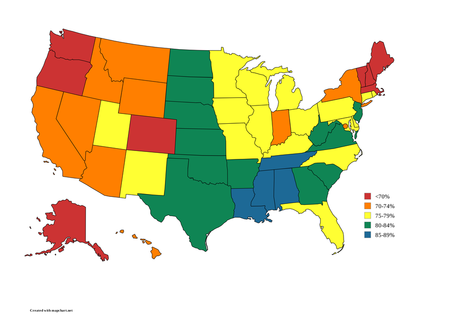
1. Religiousness Rate
This map shows what percent of Americans view themselves as "religious" in each state. This includes both Christians and other religions.
2. Life Expectancy 2019 vs 2021
You thought it was going up? Think again
It isn't just COVID: obesity, heart disease, and opioids are also doing this.
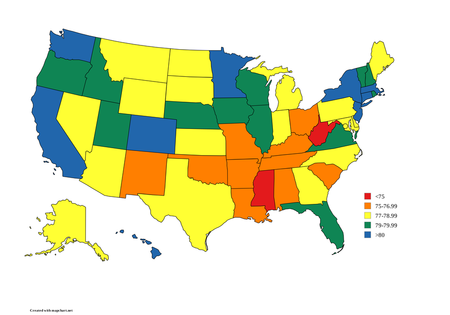
2019
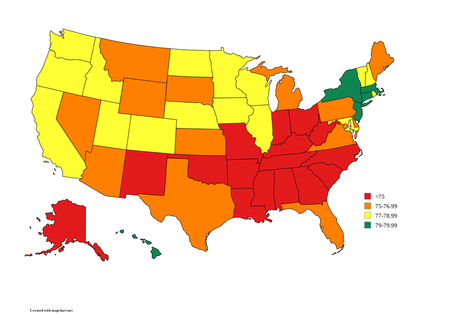
2021
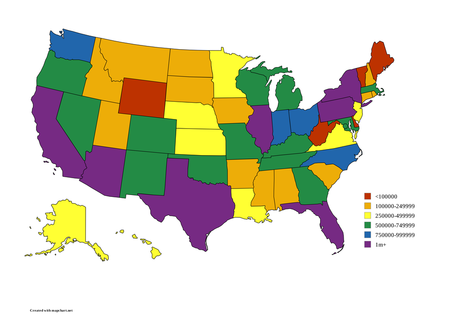
3. Population of the Largest City
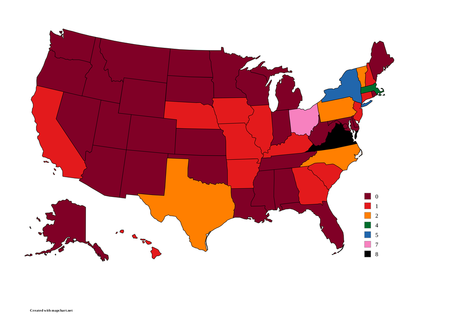
4. How many presidents were born here?
This isn't necessarily where they started their political career.
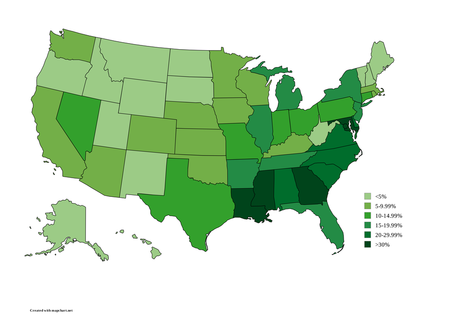
5. African American percentages
goodbye