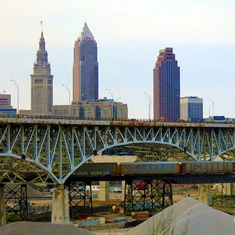
Many Rust Belt Cities have experienced large population losses starting from the 1950s. Most of them have fewer people today than in 1900. This chart compares the population data of seven major Rust Belt cities: Detroit, Columbus, Cincinnati, Pittsburgh, Buffalo, Baltimore, and St. Louis.
Copy to Clipboard
Download
Year Detroit, MI Cleveland, OH Cincinnati, OH Pittsburgh, PA Buffalo, NY Baltimore, MD St. Louis, MO
1810-08-06 770 57 2540 4768 1508 46555 1600 1820-08-07 1422 606 9642 7248 2095 62738 4977 1830-06-01 2222 1075 24831 12568 8668 80620 16469 1840-06-01 9102 6071 46338 21115 18213 102313 77860 1850-06-01 21019 17034 115435 46601 42261 169054 160773 1860-06-01 45619 43417 161044 49221 81129 212418 310864 1870-06-01 79577 92829 216239 86076 117714 267354 350518 1880-06-01 116340 160146 255139 156389 155134 332313 451770 1890-06-02 205876 261353 296908 238617 255664 434439 575238 1900-06-01 285704 381768 325902 321616 352387 508957 687029 1910-04-15 465766 560663 363591 533905 423715 558485 772897 1920-01-01 993678 796841 401247 588343 506775 733826 821960 1930-04-01 1568662 900429 451160 669817 573076 804874 816048 1940-04-01 1623452 878336 455610 671659 575901 859100 856796 1950-04-01 1849568 914808 503998 676806 580132 949708 750026 1960-04-01 1670144 876050 502550 604332 532759 939024 622236 1970-04-01 1511482 750903 452525 520117 462768 905787 453805 1980-04-01 1203368 573822 385460 423938 357870 786741 396685 1990-04-01 1027974 505616 364040 369879 328123 736016 348189 2000-04-01 951270 478403 331285 334563 292648 651154 319294 2010-04-01 713777 396815 296943 305704 261310 620961 301578 2020-04-01 639111 372624 309317 302971 278349 585708 281754